Data visualization / Independent studies
Data you can explore.
Stories you can see.
Public datasets, considered visuals, and interactive experiences that connect the big picture to individual records.
01Vancouver Open Data · Interactive atlas
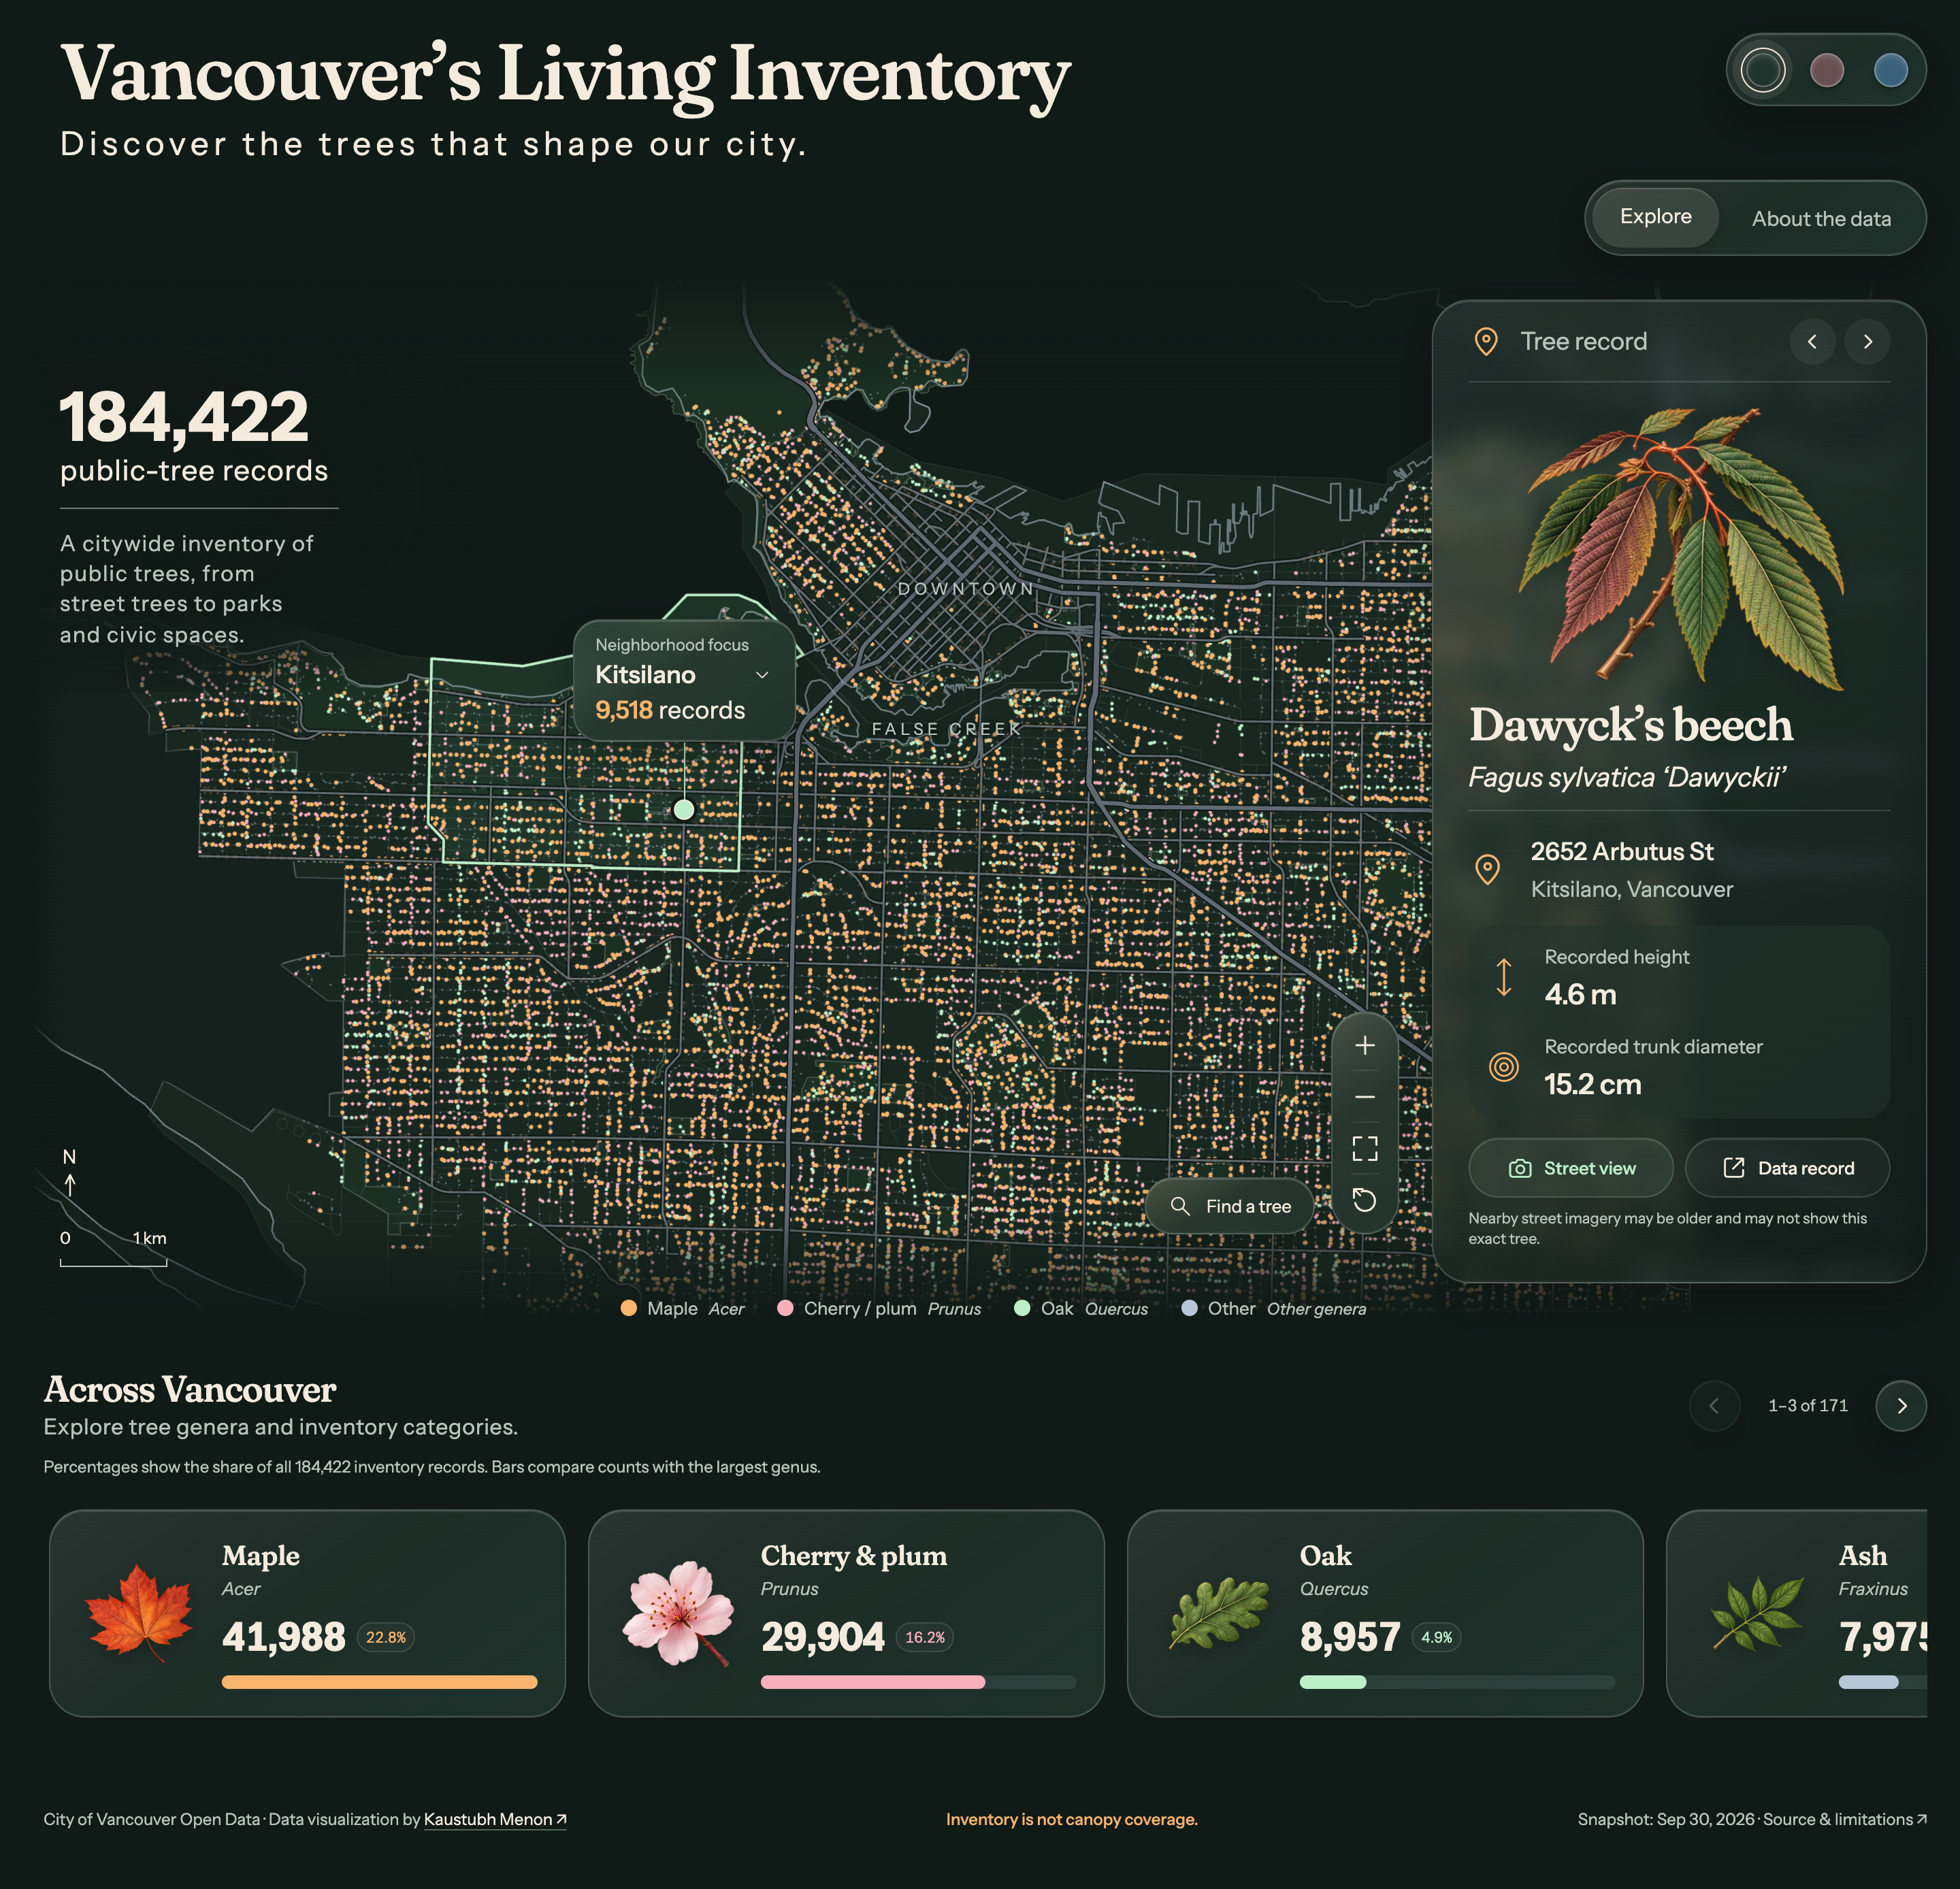
Vancouver’s Living Inventory
Explore 184,422 public-tree records through map selection, neighborhood and genus filters, searchable records, and nearby Street View. A botanical index brings 171 genera and inventory categories into view.
Inventory is not canopy coverage.02ECCC Open Data · Interactive atlas
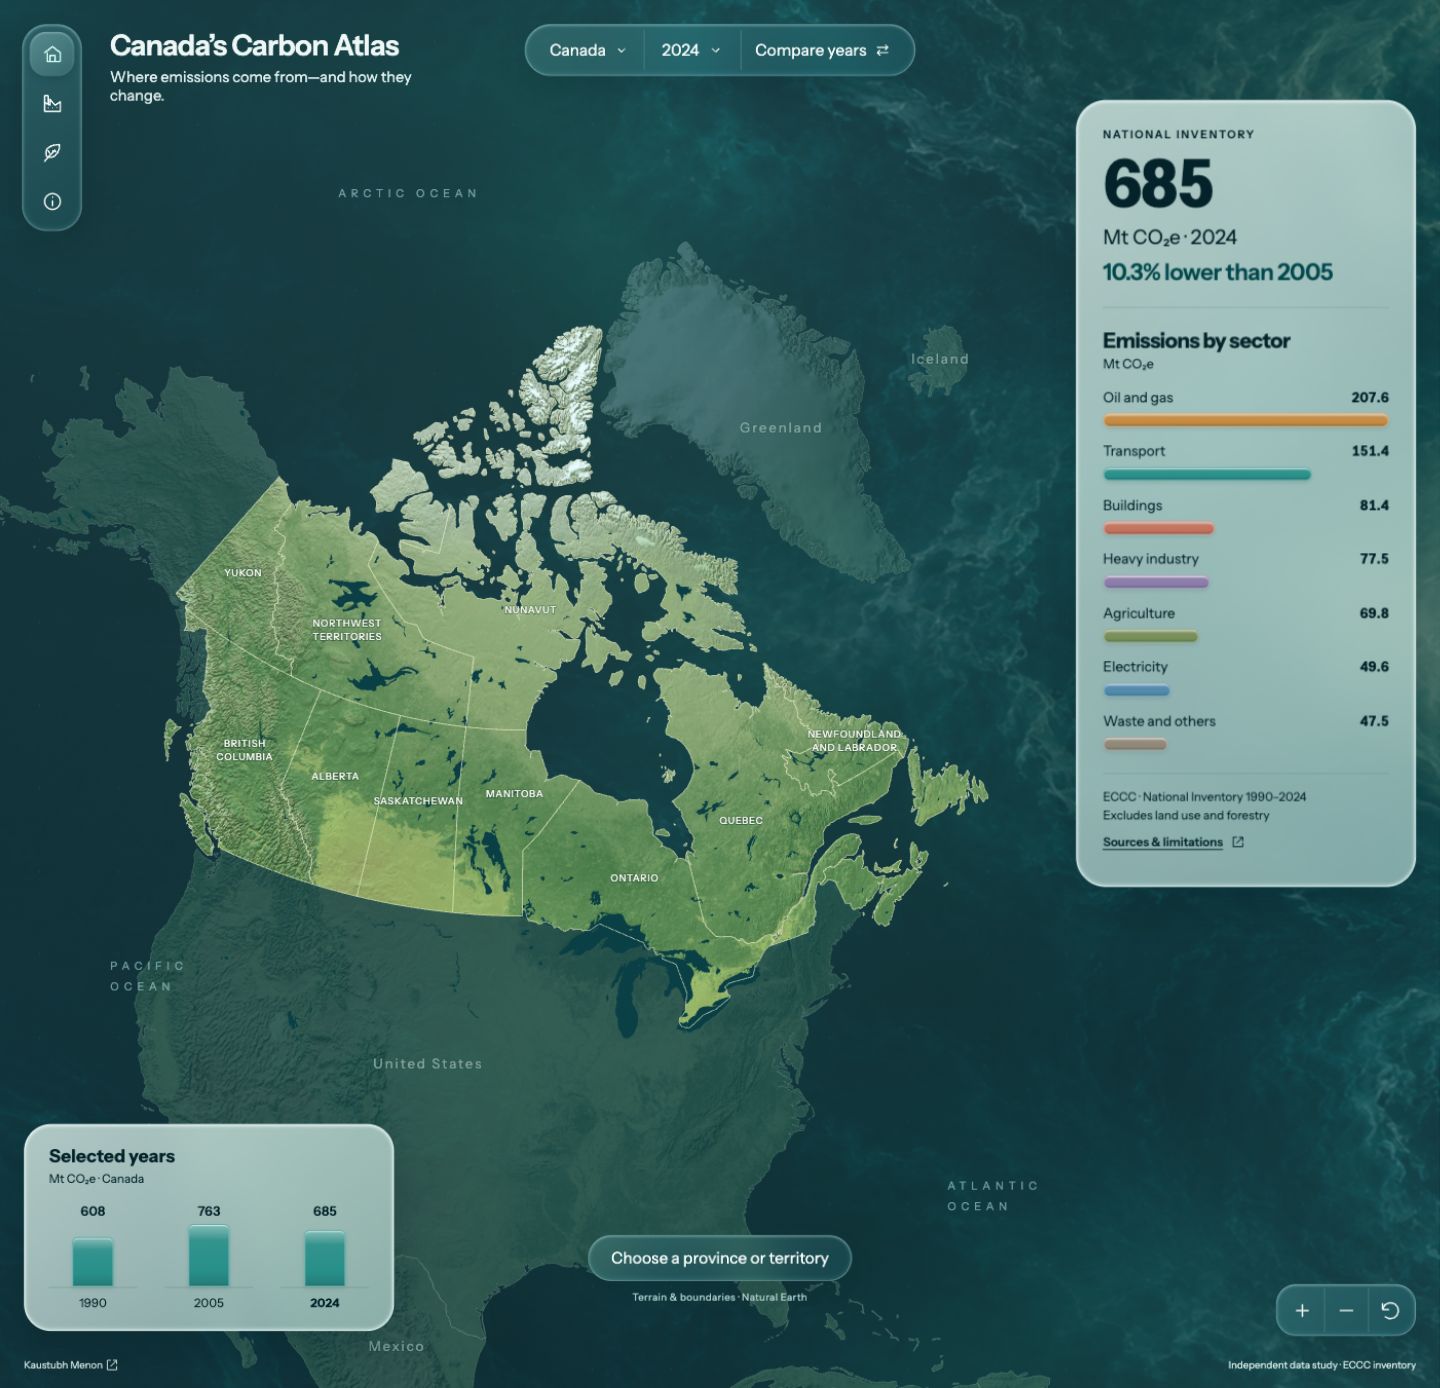
Explore Canada’s greenhouse gas inventory through province and year comparisons, then examine 1,879 reporting facilities from ECCC’s 2024 records. Search and filter by industry, select map markers, and explore carbon capture.
Facility records are a 2024 snapshot.03Metro Vancouver · Transit and sound
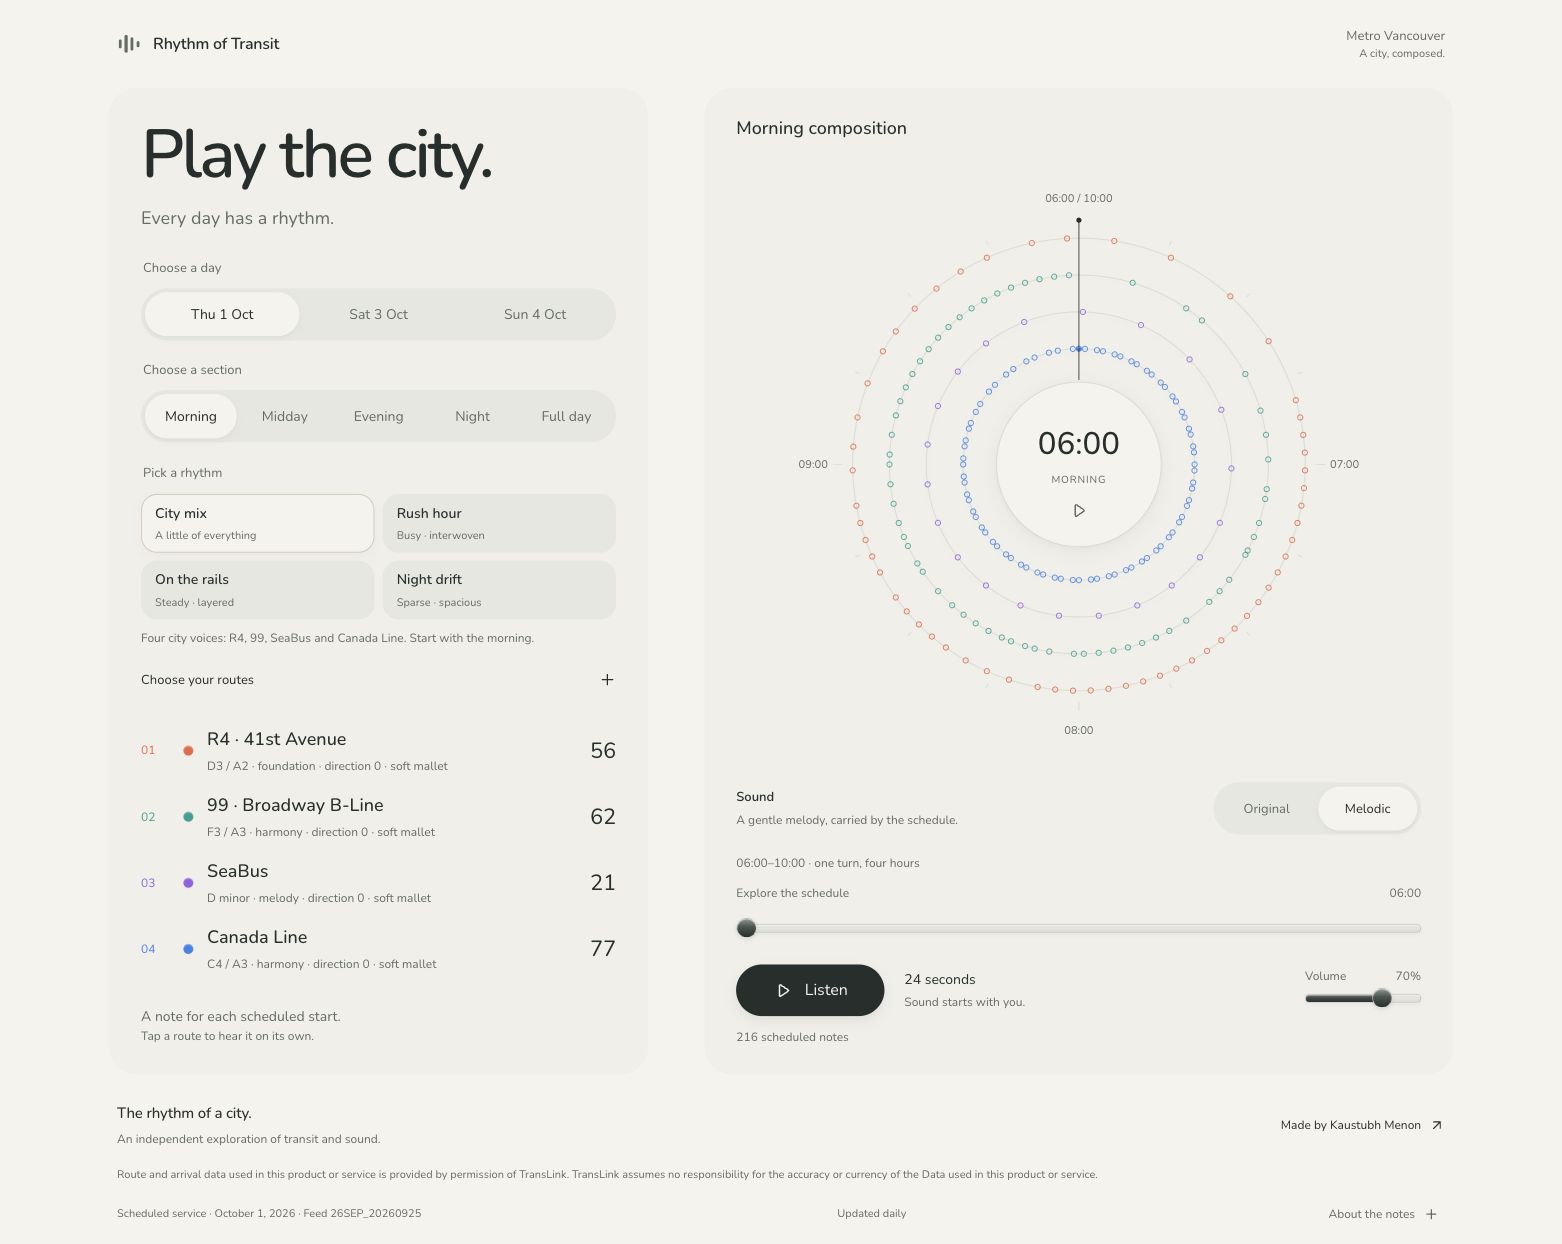
Play the city. Turn scheduled transit starts into a gentle musical composition, explore the full day, and choose your own routes and colours.
Scheduled service, not live arrivals. Sound starts with you.