06 / Data visualization · Astronomy
The Night Has a Pulse
Nine real TESS light curves reveal different rhythms in starlight. Explore stellar pulsations, eclipsing binaries and planet transits, or follow a guided journey from a glowing light to its measured pattern.
60-second summary
A light curve contains repeating structure, noise and gaps. For a reader new to astronomy, a chart alone offers little help understanding how individual observations become a recognizable rhythm.
Data visualization · Interaction design · Prototyping · Responsive web
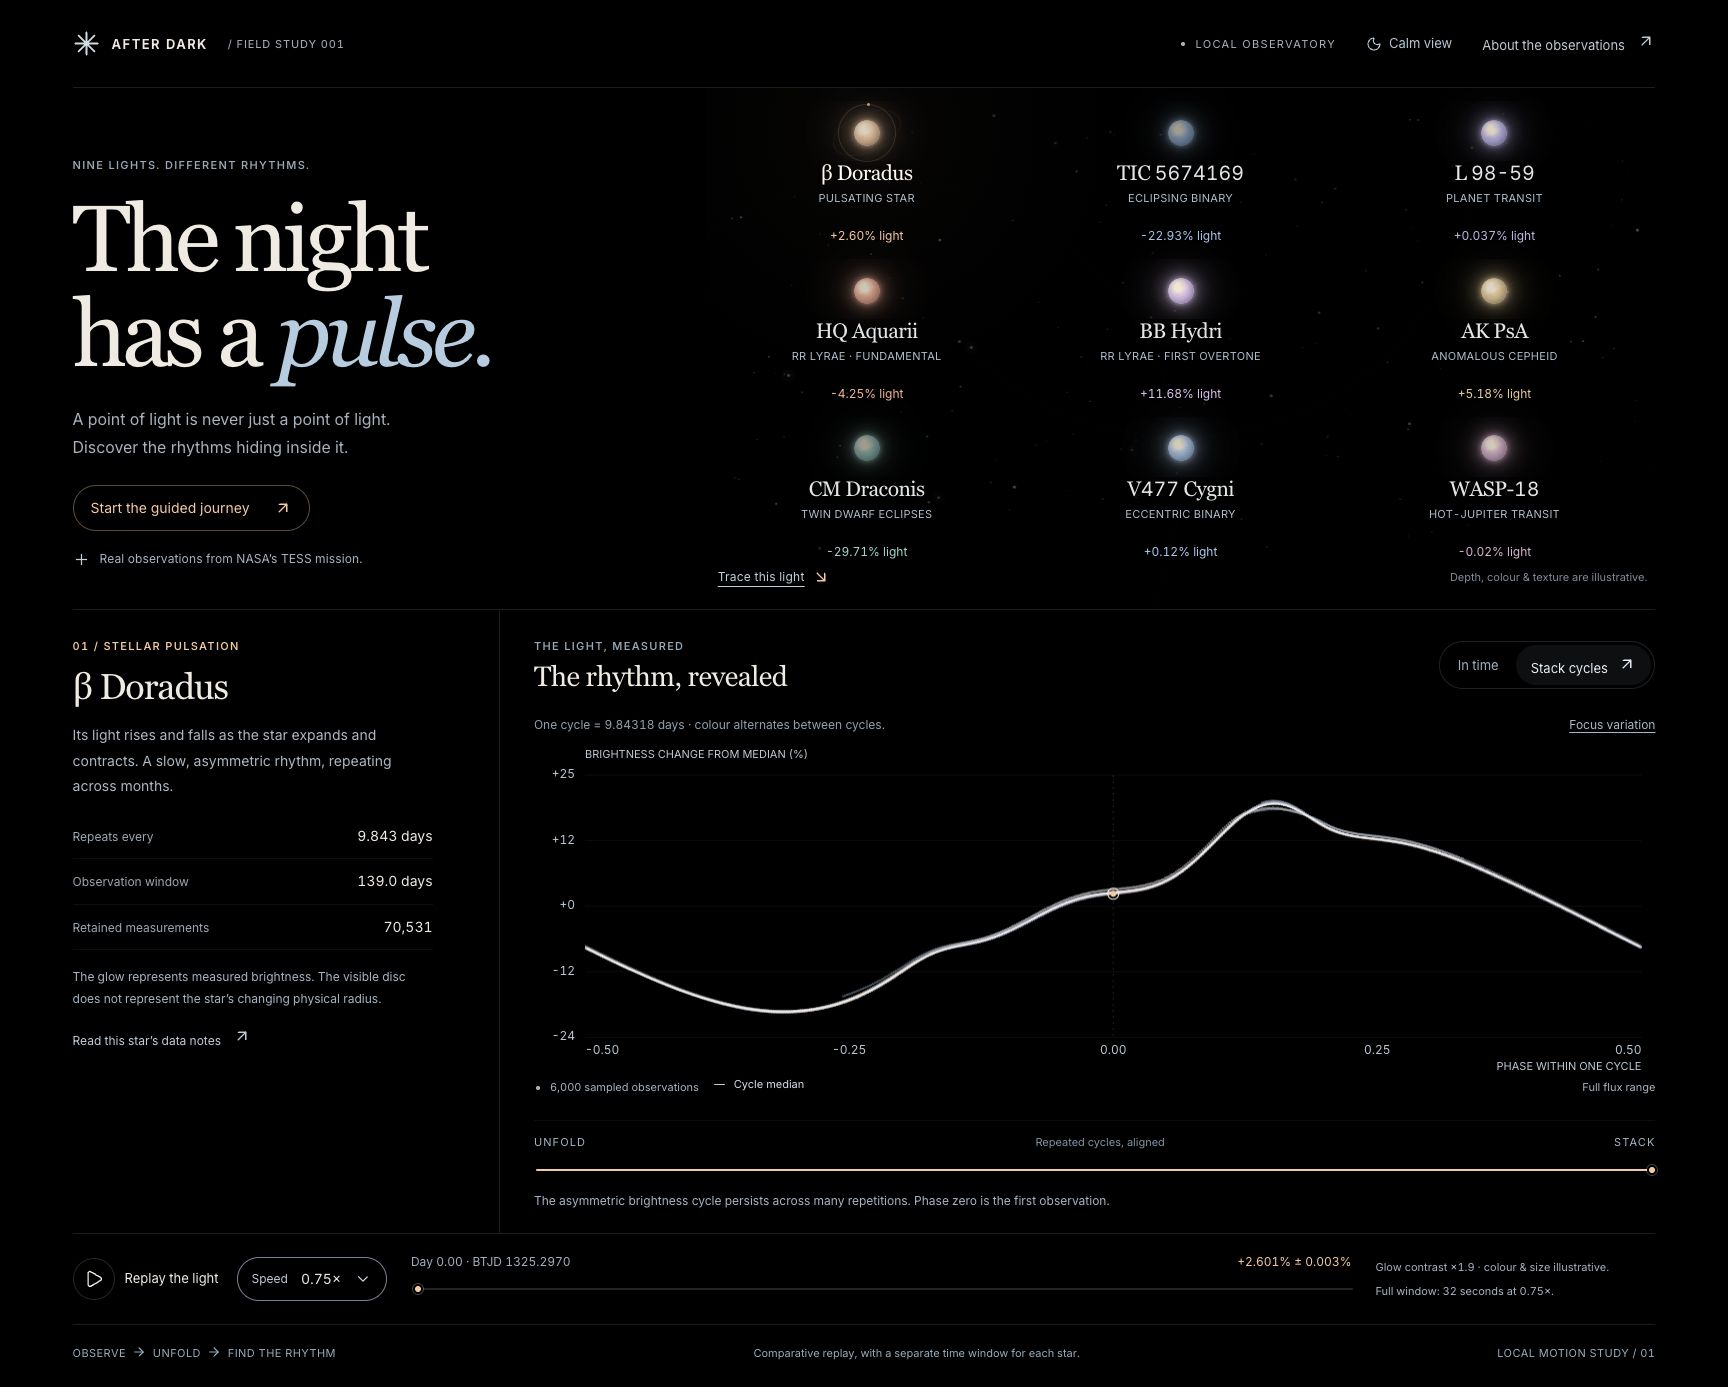
Keep the same measurements visible as the experience moves from light to timeline, separates three cycles, and brings matching cycle positions together.
A free explorer and a five-chapter scroll journey, with nine targets, adjustable replay, cycle alignment and pinned comparisons between actual observations.
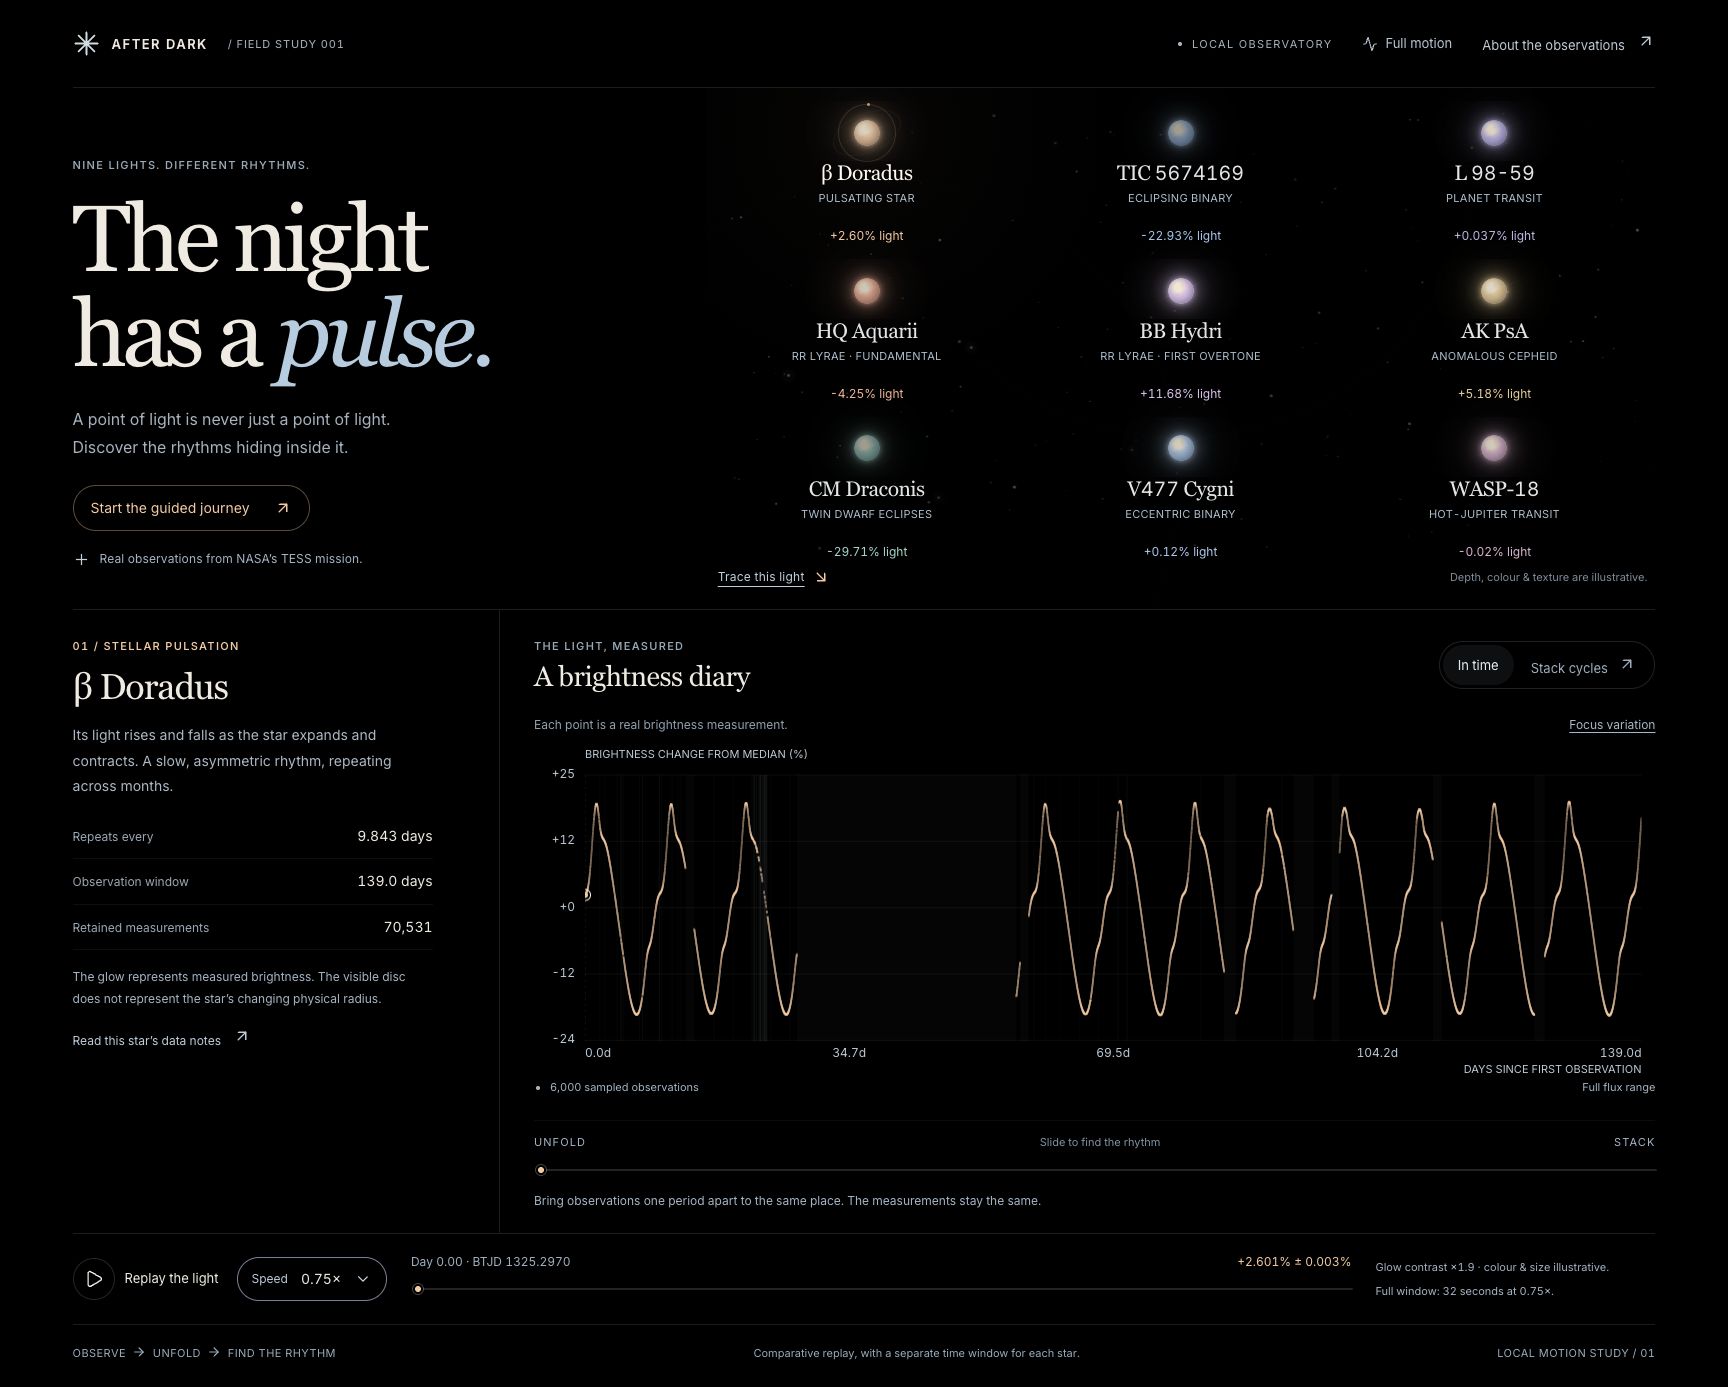
The explorer connects nine observation targets with a brightness timeline, cycle stacking and a shared replay control.
Decisions and system thinking
Let the light introduce the data
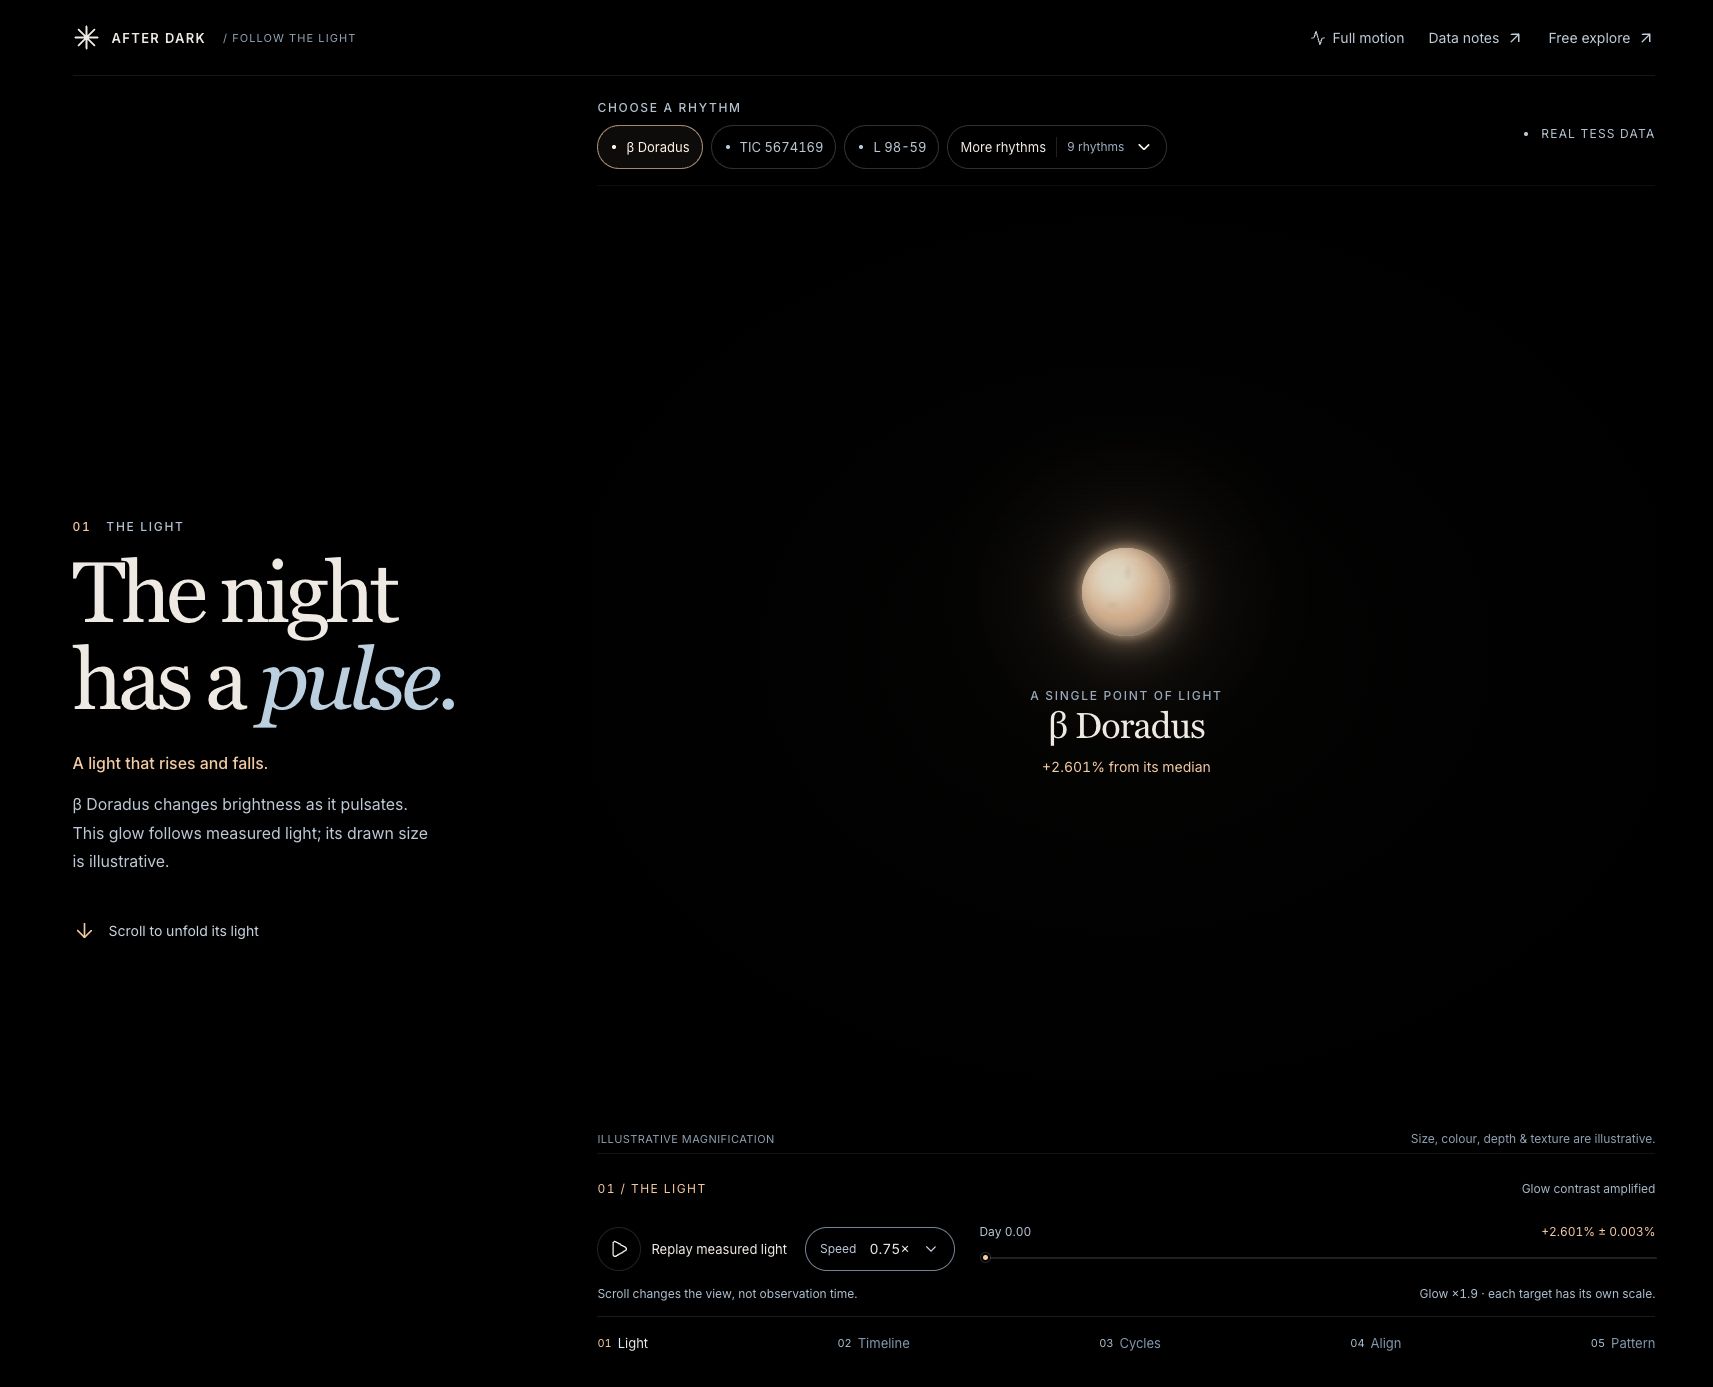
Two routes through the same observations: open exploration for curiosity, and a guided sequence that explains each transformation.
Make a changing measurement visible.
A measured-light replay introduces the brightness changes at 0.75× speed. Visitors can pause, scrub or change the rate. The glow is an amplified illustration; the source measurements and observation gaps remain intact.
Show the cycles before aligning them.
The guided journey first gives the light a timeline, then separates three example cycles. As the reader scrolls, matching positions move onto a shared chart while each measurement keeps its brightness value.
Keep comparison within reach.
In the guided journey, select a cycle position, pin it, then explore another. Each cycle connects its two measured endpoints and labels the brightness difference. A, B and C controls follow one cycle without changing the pinned comparison.
Guided journey
From a point of light to a repeating pattern
- 01Choose one of nine observation targets
- 02Replay or scrub its measured brightness
- 03See the timeline and three individual cycles
- 04Align matching cycle positions on one chart
- 05Pin a position and compare the same cycle at another position
Source and interpretation
Real observations, visible limits
The study retains 153,580 observations from NASA’s TESS mission, using archive products and published light curves. The display contains 39,762 sampled observations across nine targets; phase-bin medians summarize all retained measurements. Full retained data, quality records and per-target source notes remain available in both experiences.
Brightness is normalized separately to each target’s median. Chart ranges and glow amplification differ between targets, so the visuals do not compare intrinsic luminosity. Star size, colour, depth and motion are illustrative. Gaps stay empty, and cycle readouts use nearby real observations rather than interpolated values. Adopted periods and per-target phase origins are retained and explained in the data notes.
This is an independent design and interaction study. Interface and data-integrity checks establish recorded behavior; no user-research or comprehension improvement is claimed.
Design contribution
What I contributed across the product workflow
- Measured-light replay and visual hierarchy
- Guided scroll narrative and reversible cycle alignment
- Pinned comparisons with persistent measured endpoints
- A/B/C cycle following and keyboard controls
- Responsive layouts, SVG controls and reduced-motion presentation
- Local data packaging, source notes and integrity checks
Explore more public datasets through interactive visual experiences.