05 / Data visualization · Global perspective
The Price of Everyday Life
A global atlas that makes the price of essentials easier to explore, while keeping relative price levels, reported inflation and healthy-diet affordability distinct.
60-second summary
International cost comparisons often collapse different years, currencies and definitions into a single ranking. That makes a compelling headline, but can hide what a number actually measures.
Data visualization · Interaction design · Design engineering · Responsive web
Build one geographic entry point with three separate measures. Keep the category, benchmark year, source and missing-data boundaries visible beside every comparison.
An interactive globe with 195 places containing source data, seven price categories, comparable country views, dated inflation histories and modelled diet-affordability estimates.
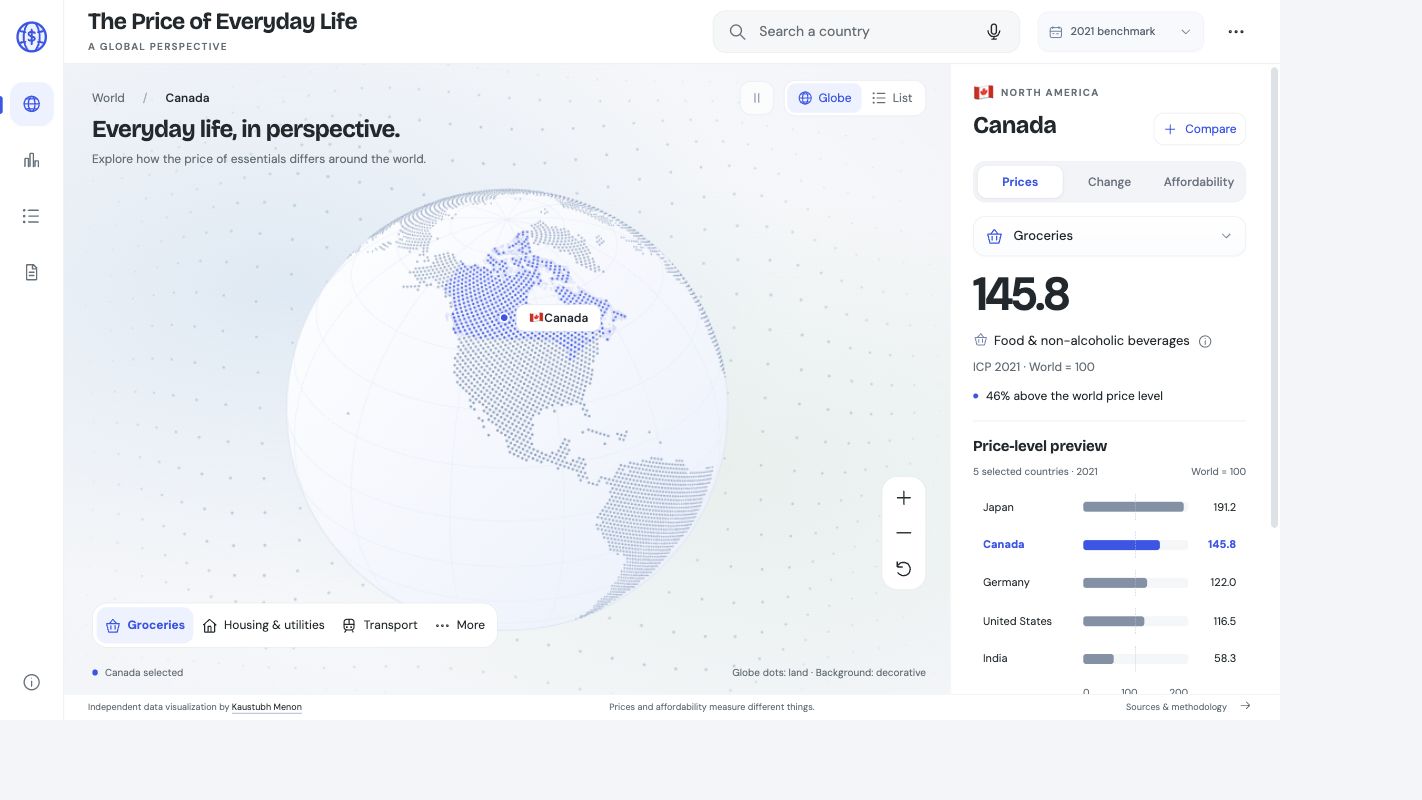
Geography provides the entry point. The country panel keeps the selected measure, reference year and comparison visible.
Decisions and system thinking
One globe. Three different questions.
The visual system connects the experience without treating different economic measures as interchangeable.
Compare a common benchmark.
Seven essential categories use World Bank ICP price-level indices from 2017 or 2021. World = 100 gives the comparison a clear reference. The 2021 grocery benchmark covers 173 economies; availability differs by category. These are national expenditure-group benchmarks, not current shop prices or city budgets.
Inspect the reported months.
The Change view shows up to 24 reported months of headline year-on-year inflation, with keyboard inspection and an exact-value table. The snapshot contains 183 national series. Dates differ across places; lower inflation does not necessarily mean prices fell.
Separate cost from ability to pay.
Food Prices for Nutrition 5.0 provides least-cost healthy-diet estimates and the modelled share unable to afford one. The 2025 unaffordability measure is available for 147 places. PPP dollars, local-currency costs and population shares retain their own units, without implying an overall affordability score.
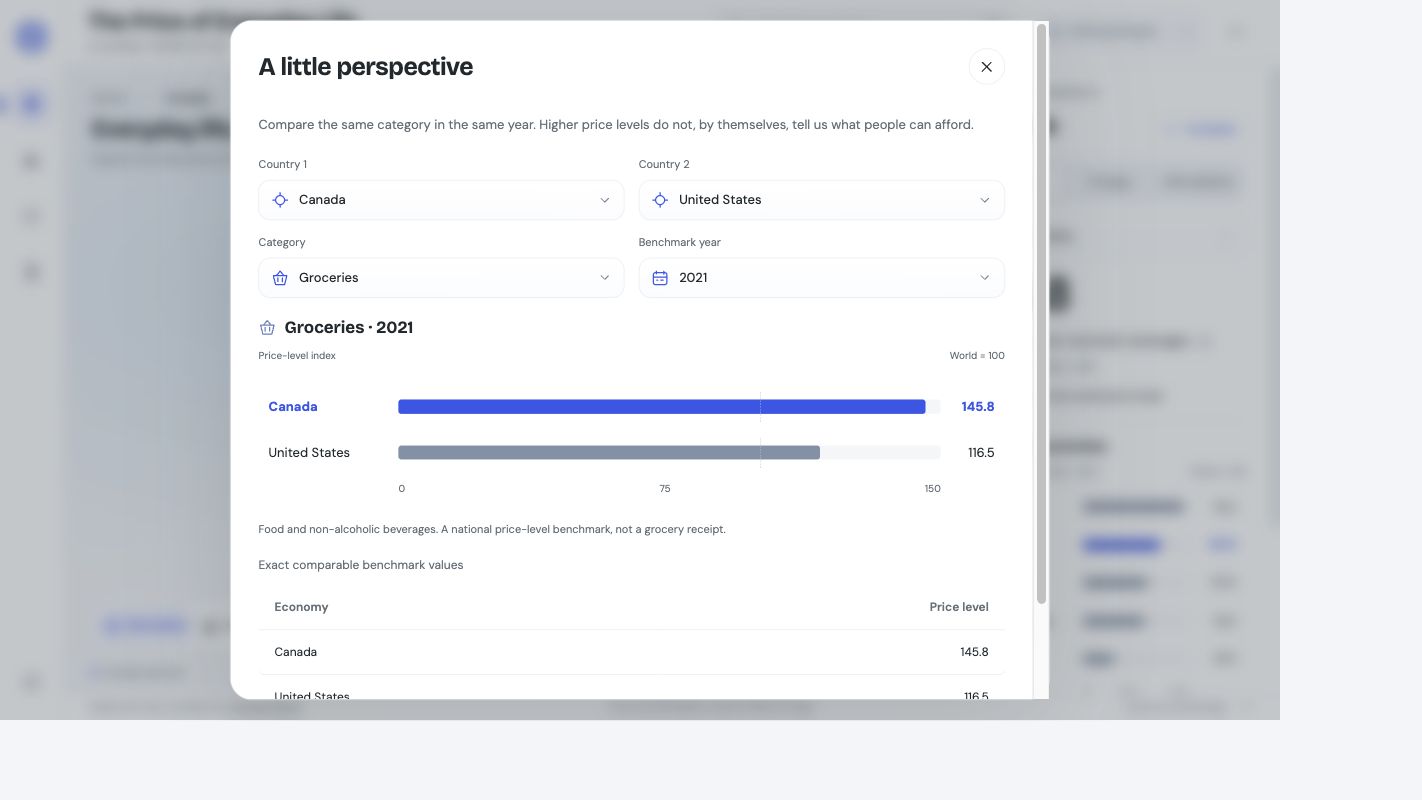
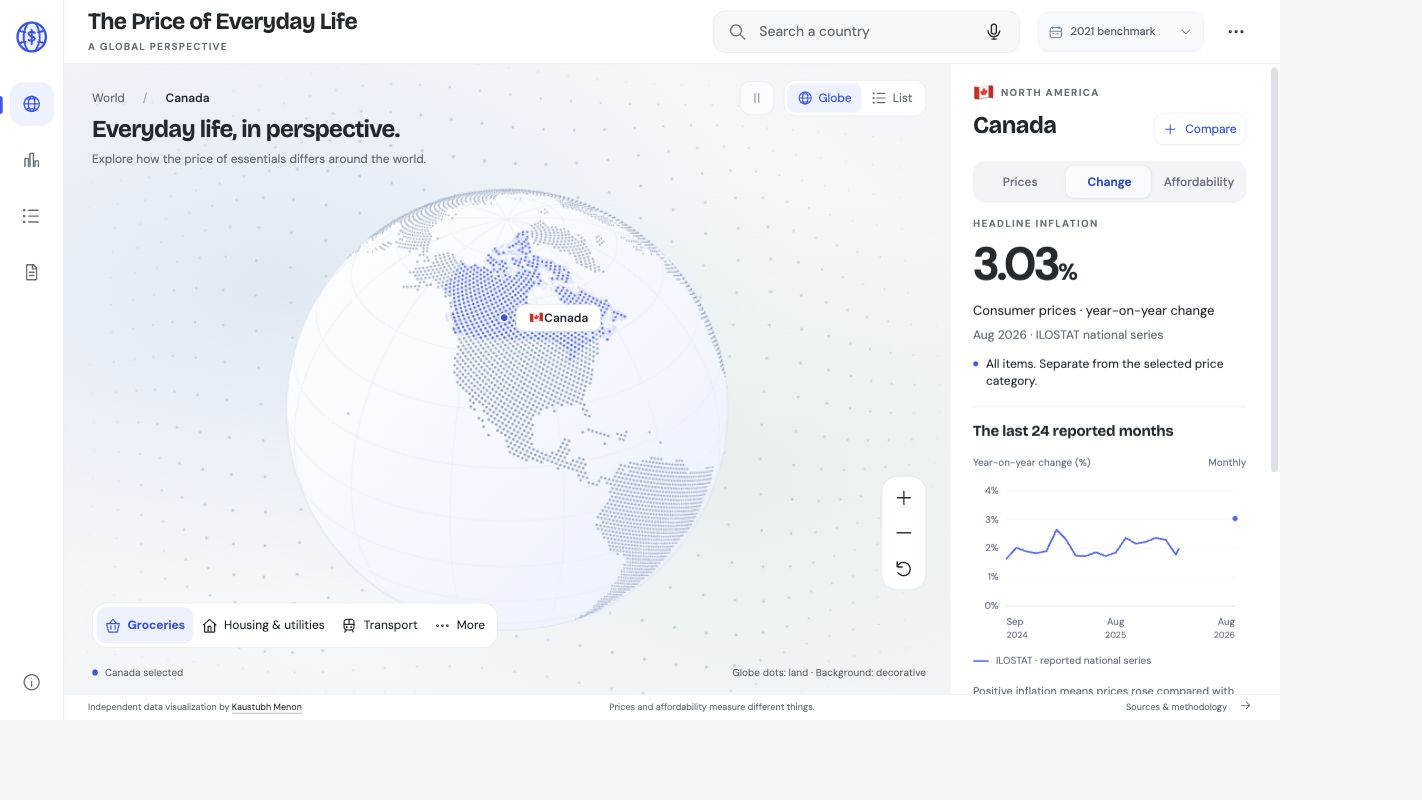
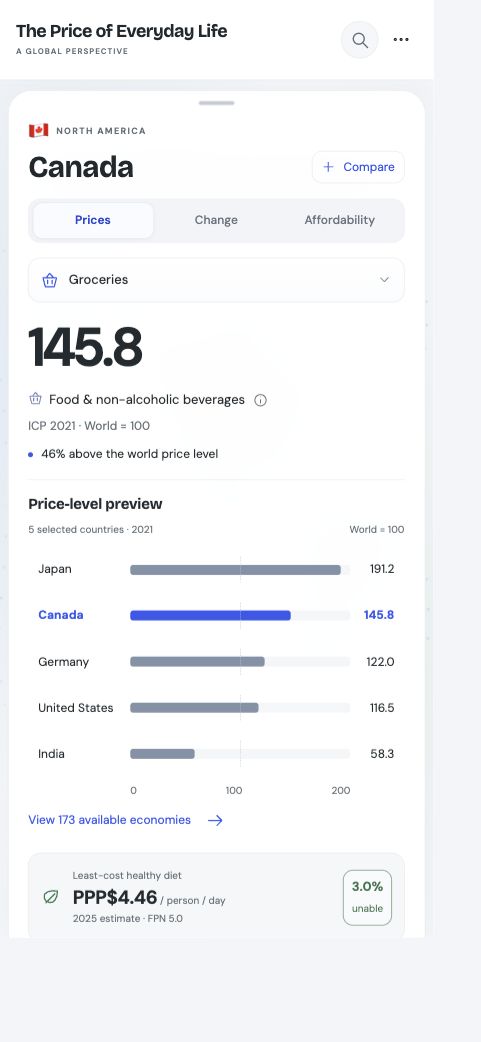
Exploration workflow
Follow a question from place to evidence
- 01Search for a country, select the globe or browse the list
- 02Choose an essential category and a shared benchmark year
- 03Compare countries or inspect the available-economy table
- 04Switch to reported inflation or healthy-diet affordability
- 05Open sources, inspect exact observations or download the snapshot
Sources and interpretation
A dated snapshot, with its limits in view
The October 25, 2026 snapshot combines World Bank ICP 2017/2021 price levels, ILOSTAT headline inflation archived on October 24, and World Bank Food Prices for Nutrition 5.0 estimates for 2021–2025. There are 242 geographic places in the atlas; 195 have at least one supported measure. The original eight-country review was reconciled against the wider extracts, but coverage is not identical across measures.
Missing observations remain unavailable rather than becoming zero. Housing and utilities share one benchmark. Health, education and recreation include public financing and do not describe household payments alone. PPP dollars are purchasing-power units, not ordinary US dollars. No combined cheapest-country score, household tax estimate or forecast is inferred.
The pointillist globe uses Natural Earth geography. Its dots depict land; the rippling background fabric is decorative. Country flags provide context without changing geographic or statistical definitions. Motion can be paused and respects reduced-motion preferences. Typed search is always available; optional voice and location depend on browser support and permission.
Design contribution
What I contributed across the product workflow
- Source feasibility, coverage and comparability review
- Pointillist globe, country search and list navigation
- Seven-category price-level comparisons and exact-value tables
- Inflation and affordability chart inspection
- Responsive drawer and accessible keyboard interactions
- SVG icon system, country flags and restrained motion
- Source attribution, missing-data states and portable portfolio integration
Explore public datasets through considered visuals and interactive experiences.